Experimental DesignA well designed experiment permits the inference of causation.
Variables in Experimental Research Independent variable (manipulated) Types of independent variables Qualitative- variation in kind or type Quantitative- variation in amount Dependent variable (measured) Should not be limited by the range of it's values. Univariate procedures look at one dependent variable at a time. Multivariate procedures look simulaneously at several dependent variables. Control in Experimentation Control by design- Blocking techniques Control by randomization The Basic Experimental Designs Between-subjects design- Participants receive only one of the levels of treatment conditions. Requires the smallest number of statistical assumptions, but more participants. Within-subjects design- Participants serve in every treatment condition. Groups are more comparable, but tests are more sensitive. Factorial design- Every level of one factor is combined with every level of the other. |
The Logic of Hypothesis TestingStatistics- summary descriptions calculated from the dats of samples.
Parameters- measures calculated from all the observations within a population. Experimental Error Can always attribute some portion of the differences observed among the treatment means to the operation of chance factors. This is called experimental error, error variability, or error variance. There are several components that contribute to a score we record from a research participant: Treatment effect- this expresses the influence of each treatment (independent variable) condition. Internal variability- temporary changes in the participant such and mood and motivation. External variability- changes outside the participant that vary such as variations in the testing environment, or measurement error. Because participants are randomly assigned to treatment groups, these components exert an unsystematic effect on the treatment conditions. Their influence is independent of the treatment effect. Experimental Error and Treatment Effects Treatment effect is the systematic source contributing to the differences. Evaluation of the Null Hypothesis When the null hypothesis is true, you can think of the ratio as contrasting two sets of differences that each reflect the presence of experimental error: 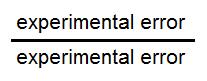
If you repat an experiment many times, you would expect the average value of this ratio to be about 1.0.
When the null hypothesis is false, then an additional component in the numerator is included that reflects the treatment effect: 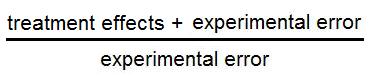
If you repat an experiment many times, you would expect the average value of
this ratio to be greater than 1.0. |
| Psych Lab |
|
